




 USD
USD
Bitcoin Flashes 8 of 12 Capitulation Signals as VanEck Sees Accumulation Nearing


Historical returns still argue against treating the readings as a confirmed market bottom
TL;DR
- VanEck says Bitcoin is showing broad capitulation conditions and may be approaching an accumulation phase, but it has not declared a final bottom.
- Comparable signal clusters historically failed to outperform Bitcoin’s normal returns over shorter horizons.
- Miner stress is severe while fund inflows have improved, leaving the market between capitulation and a fuller recovery in demand.
Trade smarter on Jupiter, Solana’s leading DEX built for fast execution and deep liquidity.
Swap tokens at competitive rates, route across multiple liquidity sources automatically, and access perpetuals, DCA, and advanced trading tools — all in one place!
Bitcoin is displaying many of the stress conditions that marked the later stages of previous selloffs, with VanEck’s Bitcoin Capitulation Check showing 8 of 12 indicators in capitulation zones as of Aug. 19, 2026. VanEck said the readings suggest Bitcoin may be nearing or entering an accumulation phase, but its historical data does not establish that the market has already reached a final bottom.
VanEck said every indicator in its framework had entered a capitulation zone at least once during the previous three months, showing broader stress than the current snapshot alone.
The signals track conditions that become extreme during heavy selling, including Bitcoin’s decline from its peak, miner economics and the share of holders sitting on losses. VanEck generally counts a signal as triggered when its reading falls into the extreme 15th percentile or lower of its own historical distribution.
Price drawdown is treated differently. VanEck activates that indicator once Bitcoin falls more than 35% from its peak rather than requiring it to reach the same historical percentile threshold. The Bitcoin price was about 49% below its all-time high, according to COIN360, but that decline ranked only around the 35th percentile of Bitcoin’s historical drawdowns. VanEck said applying the regular percentile rule to drawdown “would put us at 7 of 12 rather than 8 of 12.”
Historical Capitulation Signals Offer Little Short-Term Edge
VanEck’s historical comparison shows why the current readings are not equivalent to a short-term buy signal. Periods in which between eight and 12 indicators were flashing produced weaker average returns over shorter horizons than Bitcoin’s broader historical record, with the relative advantage appearing only over a one-year period.
VanEck’s historical record therefore gives “no edge inside of six months” from buying solely because a large cluster of capitulation indicators is active. The framework is more useful for identifying roughly where Bitcoin sits within a broader cycle than for identifying a precise near-term entry point.
Bitcoin had recovered above $64,000 on Aug. 19 after spending roughly the previous month stabilizing from a June 30 low near $58,500, which VanEck said may ultimately prove to have marked the cycle low. The Bitcoin price was near $64,300 during Asian evening trading, according to COIN360, and had largely remained between about $62,300 and $66,500 since the late-June recovery.
That stabilization occurred alongside unusually subdued market movement. Thirty-day realized volatility had fallen to 27.2% annualized compared with a long-run average near 80%, leaving Bitcoin far less volatile than its historical norm even as the asset remained deeply below its record high.
VanEck also expects the current downturn to produce a shallower trough than earlier major Bitcoin bear markets. Past cycle bottoms followed much deeper peak-to-trough losses, while the current market has a larger institutional investor base and spot Bitcoin exchange-traded products that were not present in earlier cycles.
Those earlier downturns also unfolded when institutional ownership was smaller and before the current spot ETF market. They were accompanied by major industry failures including Celsius, Three Arrows Capital and FTX, while no comparable collapse has accompanied the current correction.
Cycle Timing Points Toward a Possible Accumulation Window
VanEck examined four completed Bitcoin cycles dating from 2011 and found that peak-to-trough declines lasted an average of 11 months. Excluding the substantially smaller 2011 market, that average increased to 12.7 months.
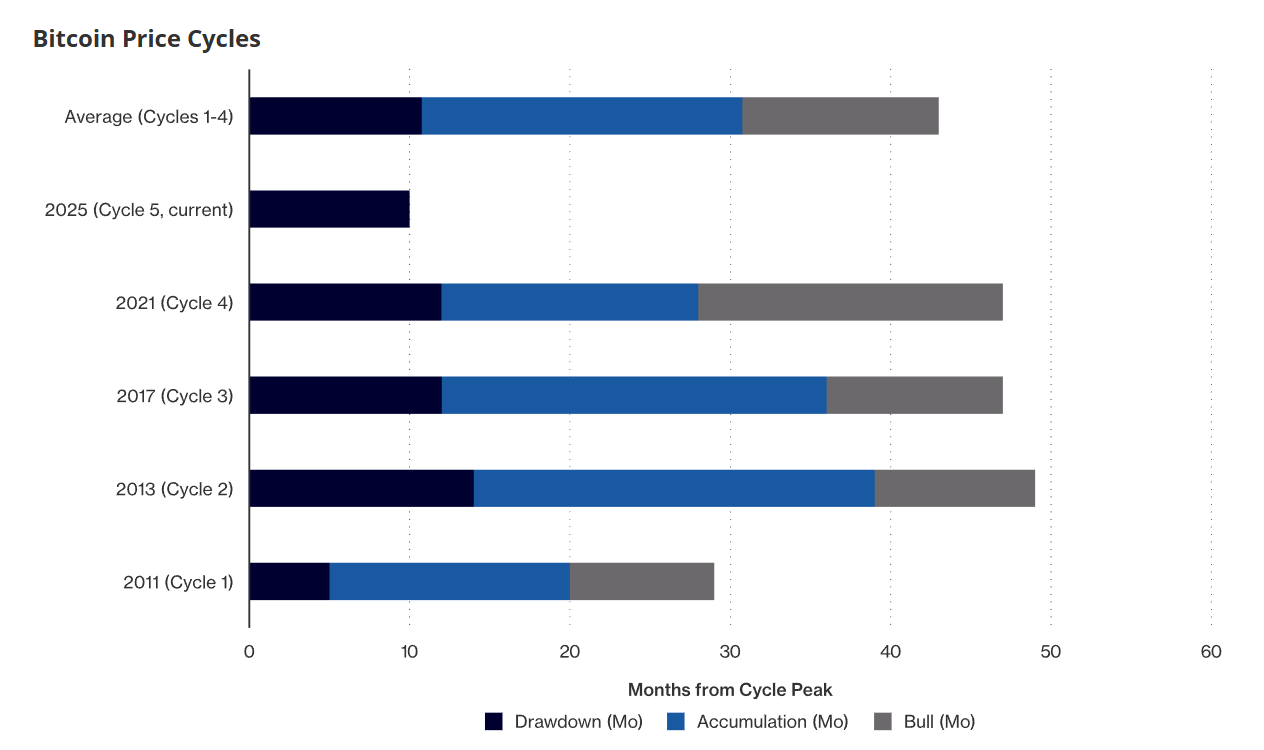
Bitcoin entered the 10th month of its decline from the October 2025 peak during August. Based on those historical durations, VanEck placed a potential next accumulation phase between September and November 2026, while declining to choose a specific date inside that period.
Miner conditions provide some of the clearest evidence that capitulation pressure has reached unusually severe levels. Daily Bitcoin mining revenue was down 46% year over year, while mining difficulty had fallen 18.3% from its November 2025 peak as unprofitable machines were switched off. That difficulty decline was the steepest since China’s mining ban in 2021.
Fund flows have been moving in the opposite direction. U.S. spot Bitcoin exchange-traded products took in about $663 million over the previous 30 days after approximately $2.4 billion of outflows during the preceding month. A separate August-to-date measurement showed more than $950 million of net inflows into U.S. spot Bitcoin ETFs.
The two figures cover different periods and measure distinct windows rather than competing estimates. Despite the recovery in fund demand, trading remained thin, with 30-day Bitcoin spot volume down 27% and sitting in the 10th percentile of its historical distribution.
Bitfinex Says Broader Capital Rotation Is Still Missing
Bitfinex said two of three conditions it considers necessary for another Bitcoin rally were already present: lower expected interest rates and already-loose financial conditions. The remaining condition is a broader flow of capital from equities, technology and AI markets into crypto.
Bitfinex pointed to negative corporate Bitcoin treasury activity and stablecoin supply remaining below its May record as signs that fresh crypto demand had not fully broadened. The exchange warned that thin market conditions mean relatively small changes in capital flows could produce an outsized move.
That leaves the current setup with simultaneous evidence of capitulation and improving institutional flows, while broader market participation remains subdued. VanEck’s framework indicates that much of the selling stress associated with previous cycle lows has already appeared, while Bitfinex’s assessment identifies capital rotation as a remaining condition for a stronger advance.
SkyBridge Capital founder Anthony Scaramucci separately told CNBC that he expects Bitcoin to return above $100,000, a level it has not closed above since November 2025. Scaramucci tied the six-digit target to the next Bitcoin halving, which was described as scheduled to occur in less than two years.
VanEck’s nearer-term conclusion remains more cautious. Its capitulation framework points toward a historically mature downturn and a possible transition toward accumulation, while its own return data shows that similar signal clusters have not historically provided superior performance over a quarter or half-year.
This article has been refined and enhanced by ChatGPT.


