Coin360 Crypto Technicals: Daily Market Navigator | May 23th 2023
PublishedMay 23 2023
•UpdatedJan 13 2025

Coin360 Crypto Technicals: Daily Market Navigator
Written By Kasper
This daily series serves a purpose to educate and give some insight and technical analysis on the current prices of the bigger cryptocurrencies, based on our technical analysis. Today we will be covering BTC, ETH, FTM, INJ, OP and SHIB on both higher and lower time frames. Don't forget to also check out our article on the fundamentals of trading and crypto technical analysis to further enhance your understanding of the market.
Crypto Spotlight
Higher Time Frame | $BTC, $ETH & $OP
Bitcoin | W1
Currently, $BTC has encountered a significant pushback from the resistance zone spanning $30-32k, as depicted in the chart. Our approach remains the same, with the subsequent vital support area situated around $24-25k, though it's unclear if this level will endure. To initiate a genuine bullish reversal, $BTC must surpass the $32k threshold, potentially paving the way for additional gains. In line with this, the Stochastic RSI appears to have reversed course, implying the likelihood of a sustained downtrend, as previously observed.

Ethereum | D1
In the daily timeframe for Ethereum ($ETH), it is apparent that the cryptocurrency is currently operating within a defined range. However, it is worth noting that the price has encountered challenges in maintaining its position above the upper boundary of this range. As a result, price rejected off the range highs and could be headed towards the midrange, assuming the current trajectory persists. In order to observe additional upward movement, it is crucial for the price to remain above the upper limits of the range.

Optimism | D1
The digital asset $OP has declined past a crucial support level as viewed on longer time frames. Current indications suggest a potential further decrease in value. However, if the price begins to reclaim the levels identified on the chart, this downward trajectory could be negated. The next significant support region is marked on the chart below for your reference.

Lower Time Frame | $BTC, $ETH, $FTM & $INJ
Bitcoin | H4
BTC price continues to exhibit range-bound trading activity. Given its prolonged period within this range, a breakout is becoming increasingly probable. If the breakout unfolds as depicted on the chart, we could foresee more upward momentum. Similarly, a downward breakout could lead to further depreciation. This pattern emphasizes the significance of monitoring both potential upward and downward trends. However it could still be played level to level from the extreme ends of the range.

Ethereum | H4
Ethereum ($ETH) has edged upwards and is currently trading in the upper section of its range. If it begins to decline and confirms that the recent minor rally was merely a deviation, we could anticipate further drops. Conversely, if the mid-range price level starts to provide support, this could signal a climb. Therefore, it's crucial to observe how $ETH interacts with these critical price points to gauge future price direction.

Fantom | H4
Fantom ($FTM) is also operating within a trading range and is presently near the lower limits of this range. As demonstrated on the chart, unless there's a breakout, it's plausible that $FTM could rebound towards the upper echelons of its current range once again. This situation underscores the potential for upward momentum within the prevailing range, barring a sudden breakout.

Injective | H4
Injective Protocol ($INJ) may see a minor relief bounce in the short-term if it can maintain the levels illustrated on the chart. This suggests that, given stable support levels, we could anticipate a slight upward shift in the immediate future.

Prior Analysis Recap
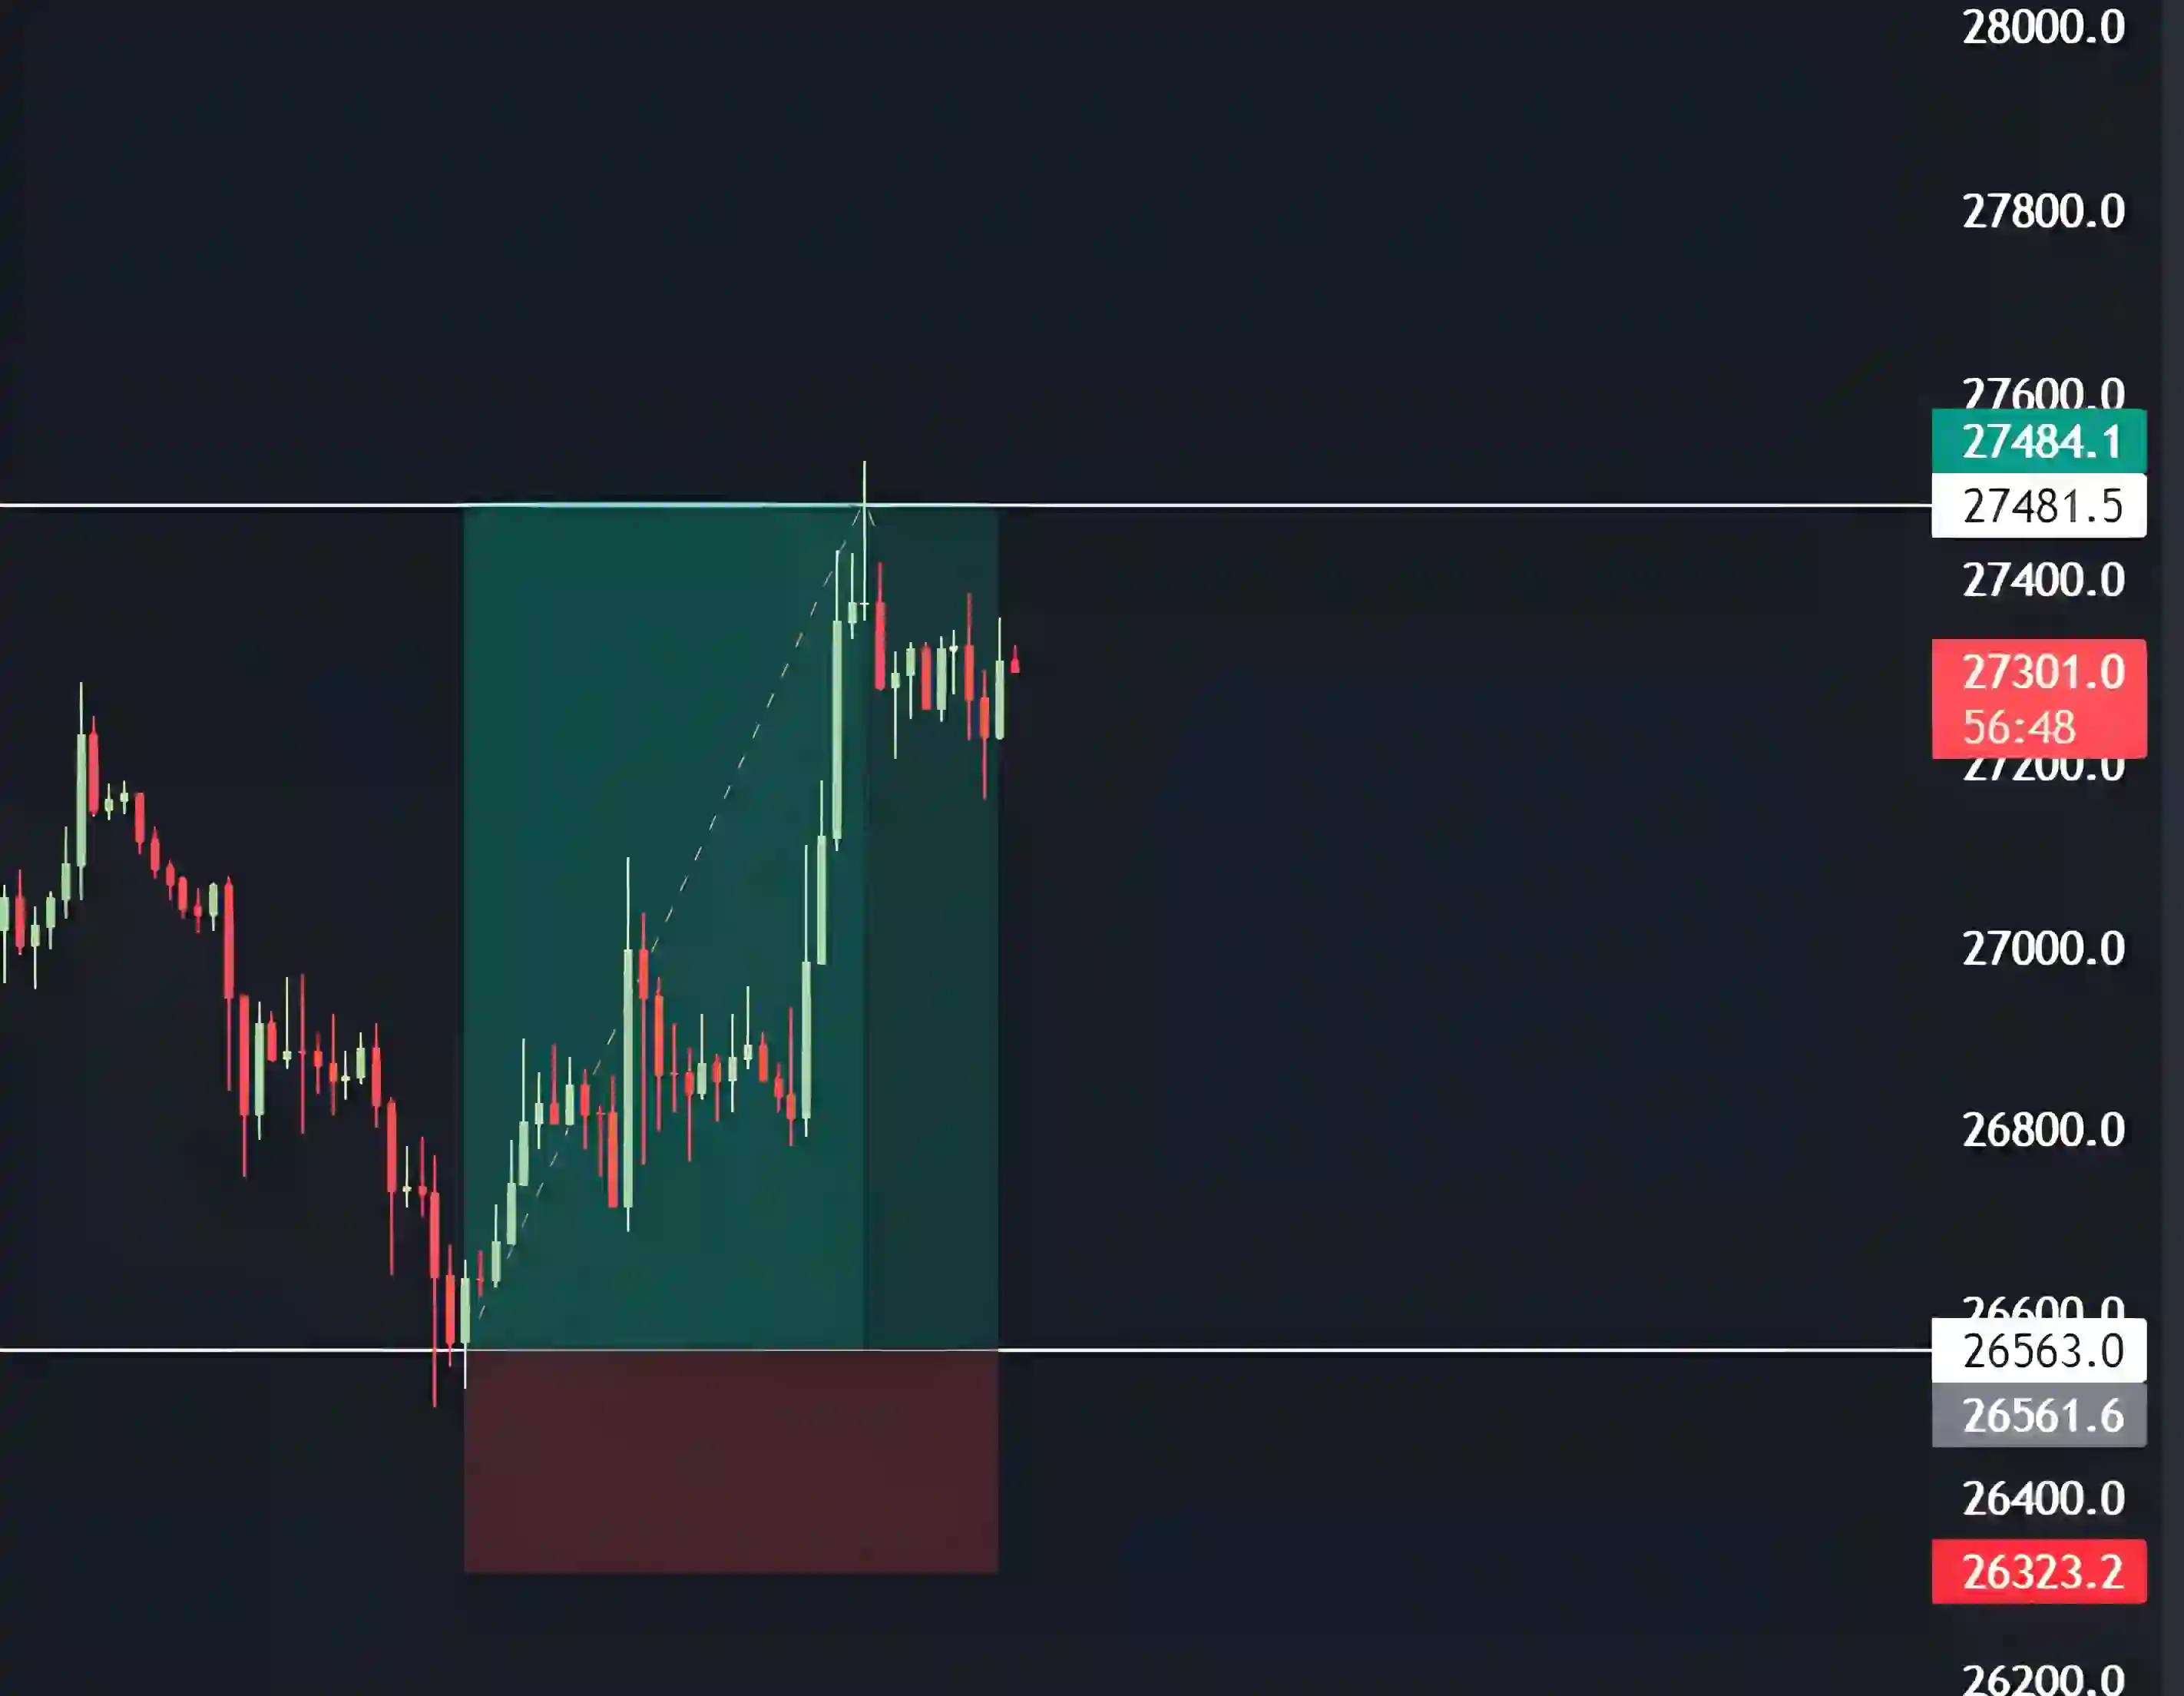
Bitcoin | H1
In our analysis from the previous day, we examined how Bitcoin ($BTC) was moving cleanly within a defined range. We proposed that if it managed to sustain its position at the range's lower limit, there was potential for it to rise towards the upper limit - which is precisely the trend that materialized. This outcome underscores the importance of observing these range boundaries in predicting future movements.
Shiba Inu | D1
In our previous discussions, we noted that Shiba Inu ($SHIB) appeared to be maintaining its position at the support level in higher time frames, suggesting a potential breakout. As it stands now, while the price movement is significant, there could still be more room for upward progression.

Watch List
To effectively monitor the coins discussed in today's analysis, consider creating a watchlist here. This will help you keep track of their price movements and stay informed about potential opportunities. These coins are worth paying attention to, as they exhibit notable market activity and could present promising trading prospects.
Market Wrap-up
In conclusion, the overall trend across various cryptocurrencies remains bearish for the time being, until we see evidence to the contrary. Most of the coins under discussion are navigating within range-bound markets, and their movements are being analyzed on a level-to-level basis. This prevailing state of affairs highlights the importance of ongoing vigilance and thorough analysis in this dynamic crypto landscape.
Disclaimer: Please note that all information, data, and technical analysis provided in this content are for educational and informational purposes only and should not be construed as investment advice, financial advice or trading advice.
This article has been refined and enhanced by ChatGPT.