Coin360 Crypto Technicals: Daily Market Navigator | June 1st 2023
PublishedJun 1 2023
•UpdatedJun 1 2023

Coin360 Crypto Technicals: Daily Market Navigator
Written By Kasper
This daily series serves a purpose to educate and give some insight and technical analysis on the current prices of the bigger cryptocurrencies, based on our technical analysis. Today we will be covering BTC, ETH, APT, MATIC, and RNDR on both higher and lower time frames. Don't forget to also check out our article on the fundamentals of trading and crypto technical analysis to further enhance your understanding of the market.
Crypto Spotlight
Higher Time Frame | $BTC, $ETH & $RNDR
Bitcoin | W1
Bitcoin ($BTC) is presently facing rejection at a significant resistance zone between $30k-$32k, indicating bearish conditions for now. The ongoing trend suggests potential movement towards a support area that lies around $24k-$25k. Concurrently, the MACD indicator appears to be crossing over, a phenomenon that has historically signaled a bearish sell-off, as depicted on the chart. For a promising bullish trajectory, we need the price to penetrate the depicted resistance area and demonstrate sustained stability above that level.

Ethereum | D1
In the daily timeframe for Ethereum ($ETH), it is apparent that the cryptocurrency is currently operating within a defined range. However, it is worth noting that the price has encountered challenges in maintaining its position above the upper boundary of this range. As a result, price rejected off the range highs and could be headed towards the midrange, assuming the current trajectory persists. In order to see strong upward movement, it is crucial for the price to remain above the upper limits of the range.

RNDR | D1
On the daily timeframe, Render Token ($RNDR) is maintaining its position above the key range high level, suggesting the potential for further upward momentum. However, should it break below this level and hold, it could decline to the lower targets indicated on the chart.

Lower Time Frame | $BTC, $ETH, $APT & $MATIC
Bitcoin | H1
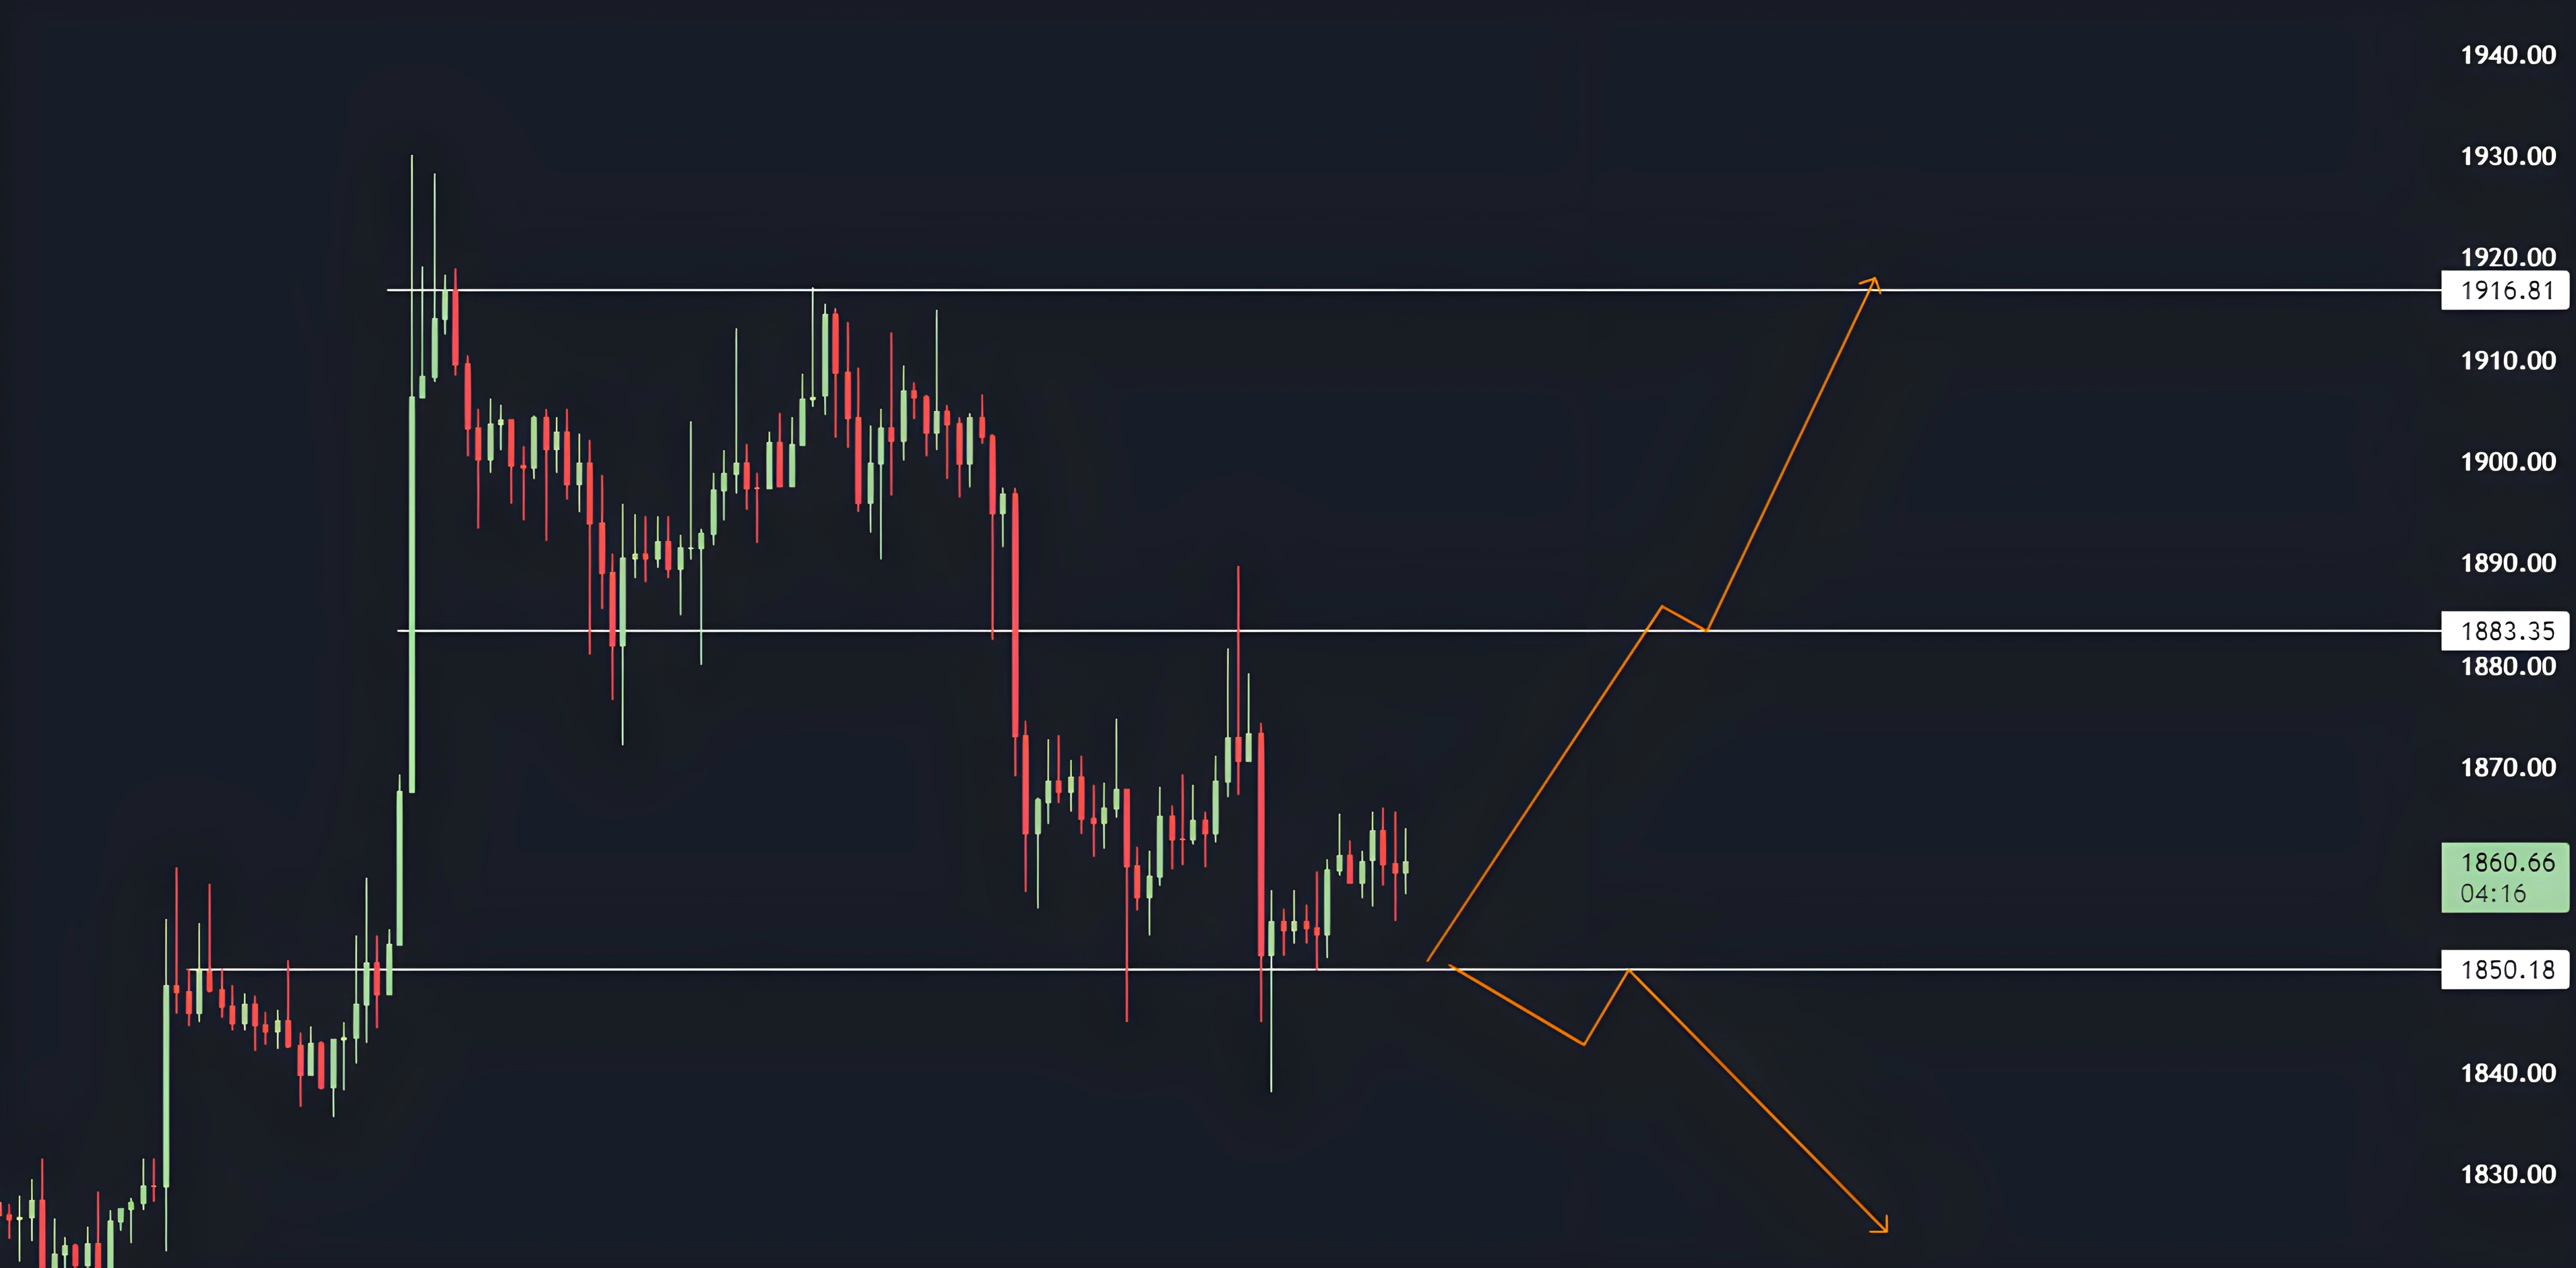
On the one-hour timeframe, if Bitcoin ($BTC) manages to flip the crucial support/resistance (SR) level, it could potentially climb higher, possibly up towards the previous range. However, if it faces rejection at this point, there's a risk it might move lower.

Ethereum | H1
On a shorter timeframe, Ethereum ($ETH) is currently trading within a specific range. If it can sustain its position above the range lows, it could potentially advance towards the mid-range and then possibly to the range highs. Conversely, if it breaks below the range lows, there's a possibility that it could trend downwards.
Aptos | H4
On a lower time frame, $APT is trading within a defined range. If the range highs are breached, it could potentially trade down towards the range lows. Given that the range highs have been tested numerous times before, it may draw liquidity towards the level indicated on the chart.

Matic | H4
For Polygon ($MATIC), if it breaks through and holds above the current level, there is potential for an upward trend. However, if it is rejected at this level and breaks through the trendline, it might initiate a downward trajectory.

Prior Analysis Recap
Aptos | D1
One of our initial analyses focused on $APT. As demonstrated, it has lost its key range support and is currently trading within the support area that we've delineated on the accompanying chart.

Watch List
To effectively monitor the coins discussed in today's analysis, consider creating a watchlist here. This will help you keep track of their price movements and stay informed about potential opportunities. These coins are worth paying attention to, as they exhibit notable market activity and could present promising trading prospects.
Market Wrap-up
In conclusion, the overall trend across various cryptocurrencies remains bearish (on the higher time frames) for the time being, until we see evidence to the contrary. Most of the coins under discussion are navigating within range-bound markets, and their movements are being analyzed on a level-to-level basis. However we might see a bullish temporary rally as bitcoin has some resting liquidity at $28.6k. This prevailing state of affairs highlights the importance of ongoing vigilance and thorough analysis in this dynamic crypto landscape.
Disclaimer: Please note that all information, data, and technical analysis provided in this content are for educational and informational purposes only and should not be construed as investment advice, financial advice or trading advice.
This article has been refined and enhanced by ChatGPT.