Coin360 Crypto Technicals: Daily Market Navigator | June 12th 2023
PublishedJun 12 2023
•UpdatedJun 12 2023

Coin360 Crypto Technicals: Daily Market Navigator
Written By Kasper
This daily series serves a purpose to educate and give some insight and technical analysis on the current prices of the bigger cryptocurrencies, based on our technical analysis. Today we will be covering BTC, ETH, MATIC, and STX on both higher and lower time frames. Don't forget to also check out our article on the fundamentals of trading and crypto technical analysis to further enhance your understanding of the market.
Crypto Spotlight
Higher Time Frame | $BTC, $ETH, $MATIC, & $STX
Bitcoin | W1
In our weekly timeframe analysis for Bitcoin ($BTC), it currently appears to be on an upward trend. However, it's important to note that trends can shift, especially given this is a longer-term projection. Anticipating market fluctuations, we predict a dip into the area previously indicated on our chart. This anticipated movement shouldn't necessarily alarm investors; it could indeed be a bullish signal, provided Bitcoin maintains its value within this marked zone. The crucial factor to watch here is Bitcoin's capacity to hold its position through this dip.

Ethereum | D1
Ethereum ($ETH) is currently trading at a crucial level according to our daily chart analysis. There are two primary scenarios to consider:
- If Ethereum breaks through this key level and maintains a position below it, we can expect the price to continue to drop further.
- Alternatively, if Ethereum manages to hold at this critical juncture, it could indicate the potential for an upward trend.
In essence, the future trajectory for Ethereum will depend on its ability to either uphold or breach this pivotal price point. As of now it is holding above.
Matic | D1
In our daily timeframe analysis, Polygon ($MATIC) is demonstrating the potential for a short-term rally. However, if the price fails to hold above the critical level marked on our chart and instead falls below it, we might expect a downward trend.
Supporting this perspective is the relative performance of the $MATIC/Bitcoin ($BTC) pair, which appears bearish. Notably, it has broken below significant support levels. Therefore, unless Polygon can maintain its price above the marked level, we could foresee further declines. This viewpoint aligns with the current bearish outlook on the $MATIC/$BTC pairing.


Stx | D1
In the daily chart analysis, Stacks ($STX) currently stands at a pivotal support level. There are two possible outcomes to watch for:
- If Stacks fails to uphold this level, we can anticipate a decline in price to the lower levels as marked on the chart.
- Conversely, if it manages to maintain above this critical support, we may see a reversal in the trend.
Further affirming this bearish perspective is the performance of the $STX/Bitcoin ($BTC) pair, which has fallen below vital support levels. Thus, the outlook for Stacks leans towards the bearish side unless it can successfully maintain its current support level.


Lower Time Frame | $BTC & $ETH
Bitcoin | H4
Bitcoin ($BTC) is currently trading within a crucial price range according to our analysis. Here are the scenarios we're closely observing:
- If Bitcoin can maintain its current level and doesn't fall below the lower boundary marked on our chart, we may be looking at a possible rally.
- On the other hand, if the price doesn't uphold its position above the marked lower level, we might see a continuation of the current downward trend.
In essence, Bitcoin's potential for another rally hinges on its ability to hold above the critical level outlined on our chart. The future trend will largely depend on how well it can sustain its current price point.

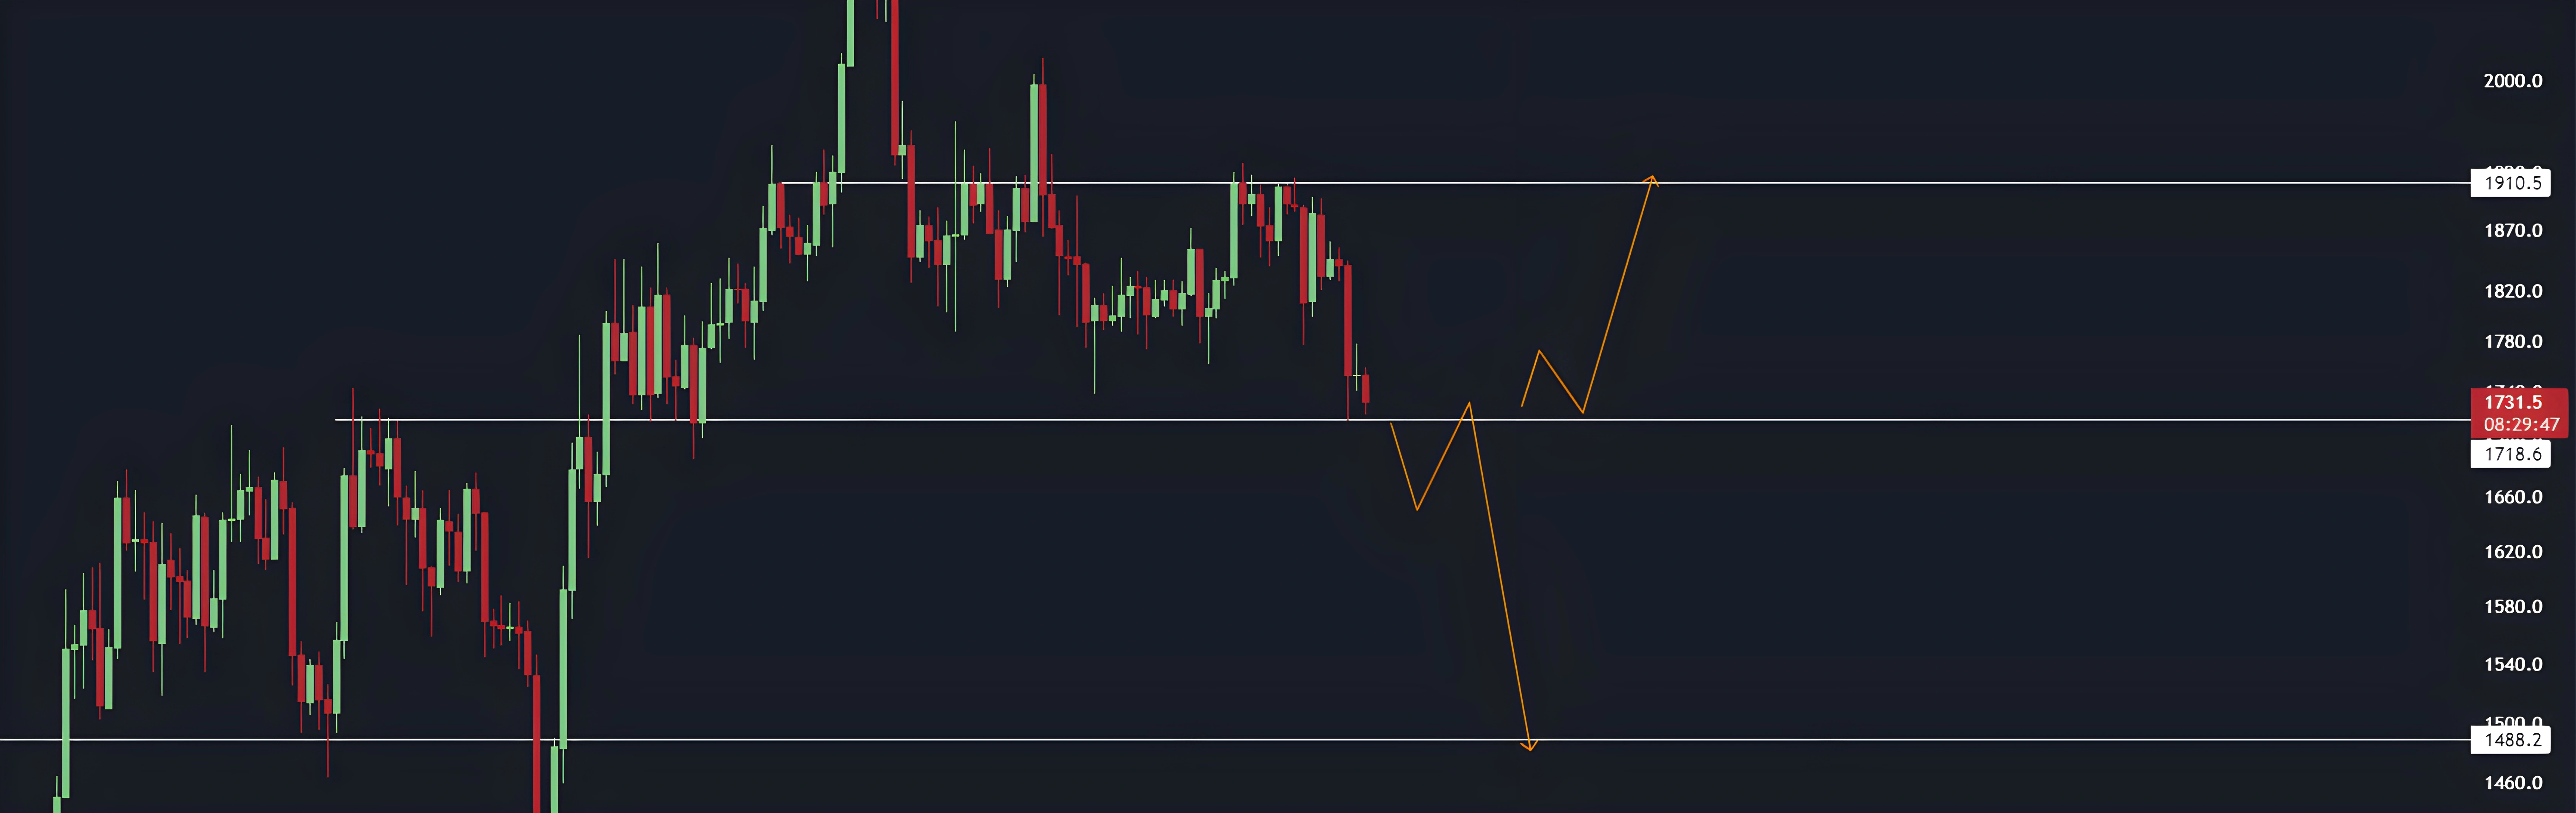
Ethereum | H1
Upon analyzing Ethereum ($ETH) on a lower time frame, we find it hovering near the lower end of its current range. Here are the two primary scenarios we're examining:
- Considering its current position, there's potential for Ethereum to rise if it can maintain and rebound from this range low.
- Conversely, if Ethereum breaks through the range low and continues to trade below this level, we could foresee further depreciation in its price.
In summary, Ethereum's path could potentially go higher given its proximity to the range lows. However, should it breach these lows and remain there, we should brace for a further decline in its value.

Prior Analysis Recap
Bitcoin | H4
Bitcoin ($BTC) was unable to surpass the resistance level indicated on our chart, resulting in a subsequent decrease in its value. As predicted, this decline has brought Bitcoin's trading price into the region we previously marked on our chart. In other words, Bitcoin's failure to overcome the noted resistance led to a downward trend, hitting the predicted lower levels.

Watch List
To effectively monitor the coins discussed in today's analysis, consider creating a watchlist here. This will help you keep track of their price movements and stay informed about potential opportunities. These coins are worth paying attention to, as they exhibit notable market activity and could present promising trading prospects.
Market Wrap-up
In conclusion, the overall trend across various cryptocurrencies remains bearish for the time being, until we see evidence to the contrary. Most of the coins under discussion are navigating within range-bound markets, and their movements are being analyzed on a level-to-level basis. This prevailing state of affairs highlights the importance of ongoing vigilance and thorough analysis in this dynamic crypto landscape.
Disclaimer: Please note that all information, data, and technical analysis provided in this content are for educational and informational purposes only and should not be construed as investment advice, financial advice or trading advice.
This article has been refined and enhanced by ChatGPT.