Coin360 Crypto Technicals: Daily Market Navigator | June 29th 2023
PublishedJun 29 2023
•UpdatedJun 29 2023

Coin360 Crypto Technicals: Daily Market Navigator
Written By Kasper
This daily series serves a purpose to educate and give some insight and technical analysis on the current prices of the bigger cryptocurrencies, based on our technical analysis. Today we will be covering BTC, ETH, LINK, APT and SOL on both higher and lower time frames. Don't forget to also check out our article on the fundamentals of trading and crypto technical analysis to further enhance your understanding of the market.
Crypto Spotlight
Higher Time Frame | $BTC, $ETH, $LINK, $APT
Bitcoin | W1
Our analysis of Bitcoin ($BTC) reveals a prevailing bullish trend, with a significant rebound from a key support zone. Market sentiment leans bullish until further, substantial evidence suggests otherwise. For additional price appreciation, Bitcoin must transform the noted resistance level into a support; failure to do so could potentially trigger a pullback.

Ethereum | D1
Currently, the Ethereum ($ETH) daily chart appears somewhat bearish unless the price can surpass the resistance level marked on the chart. Until then, that marked level serves as resistance.

Chainlink | W1
Upon examining the higher timeframe, Chainlink ($LINK) appears to be following a bearish trend. In order to witness any further upward momentum, it is crucial for $LINK to maintain its position above the resistance level outlined on the chart.

Aptos | W1
At a glance, the higher timeframe for APT Coin ($APT) seems to display a bearish trend. To expect any upward movement, the coin needs to sustain a position above the resistance level indicated on the chart.

Lower Time Frame | $BTC, $ETH,
Bitcoin | H4
To anticipate further upward movement in Bitcoin ($BTC), we'd like to see a candlestick closing above the marked line on the chart, which is currently acting as a resistance level. Until this occurs, it's probable that $BTC will retest its support level.

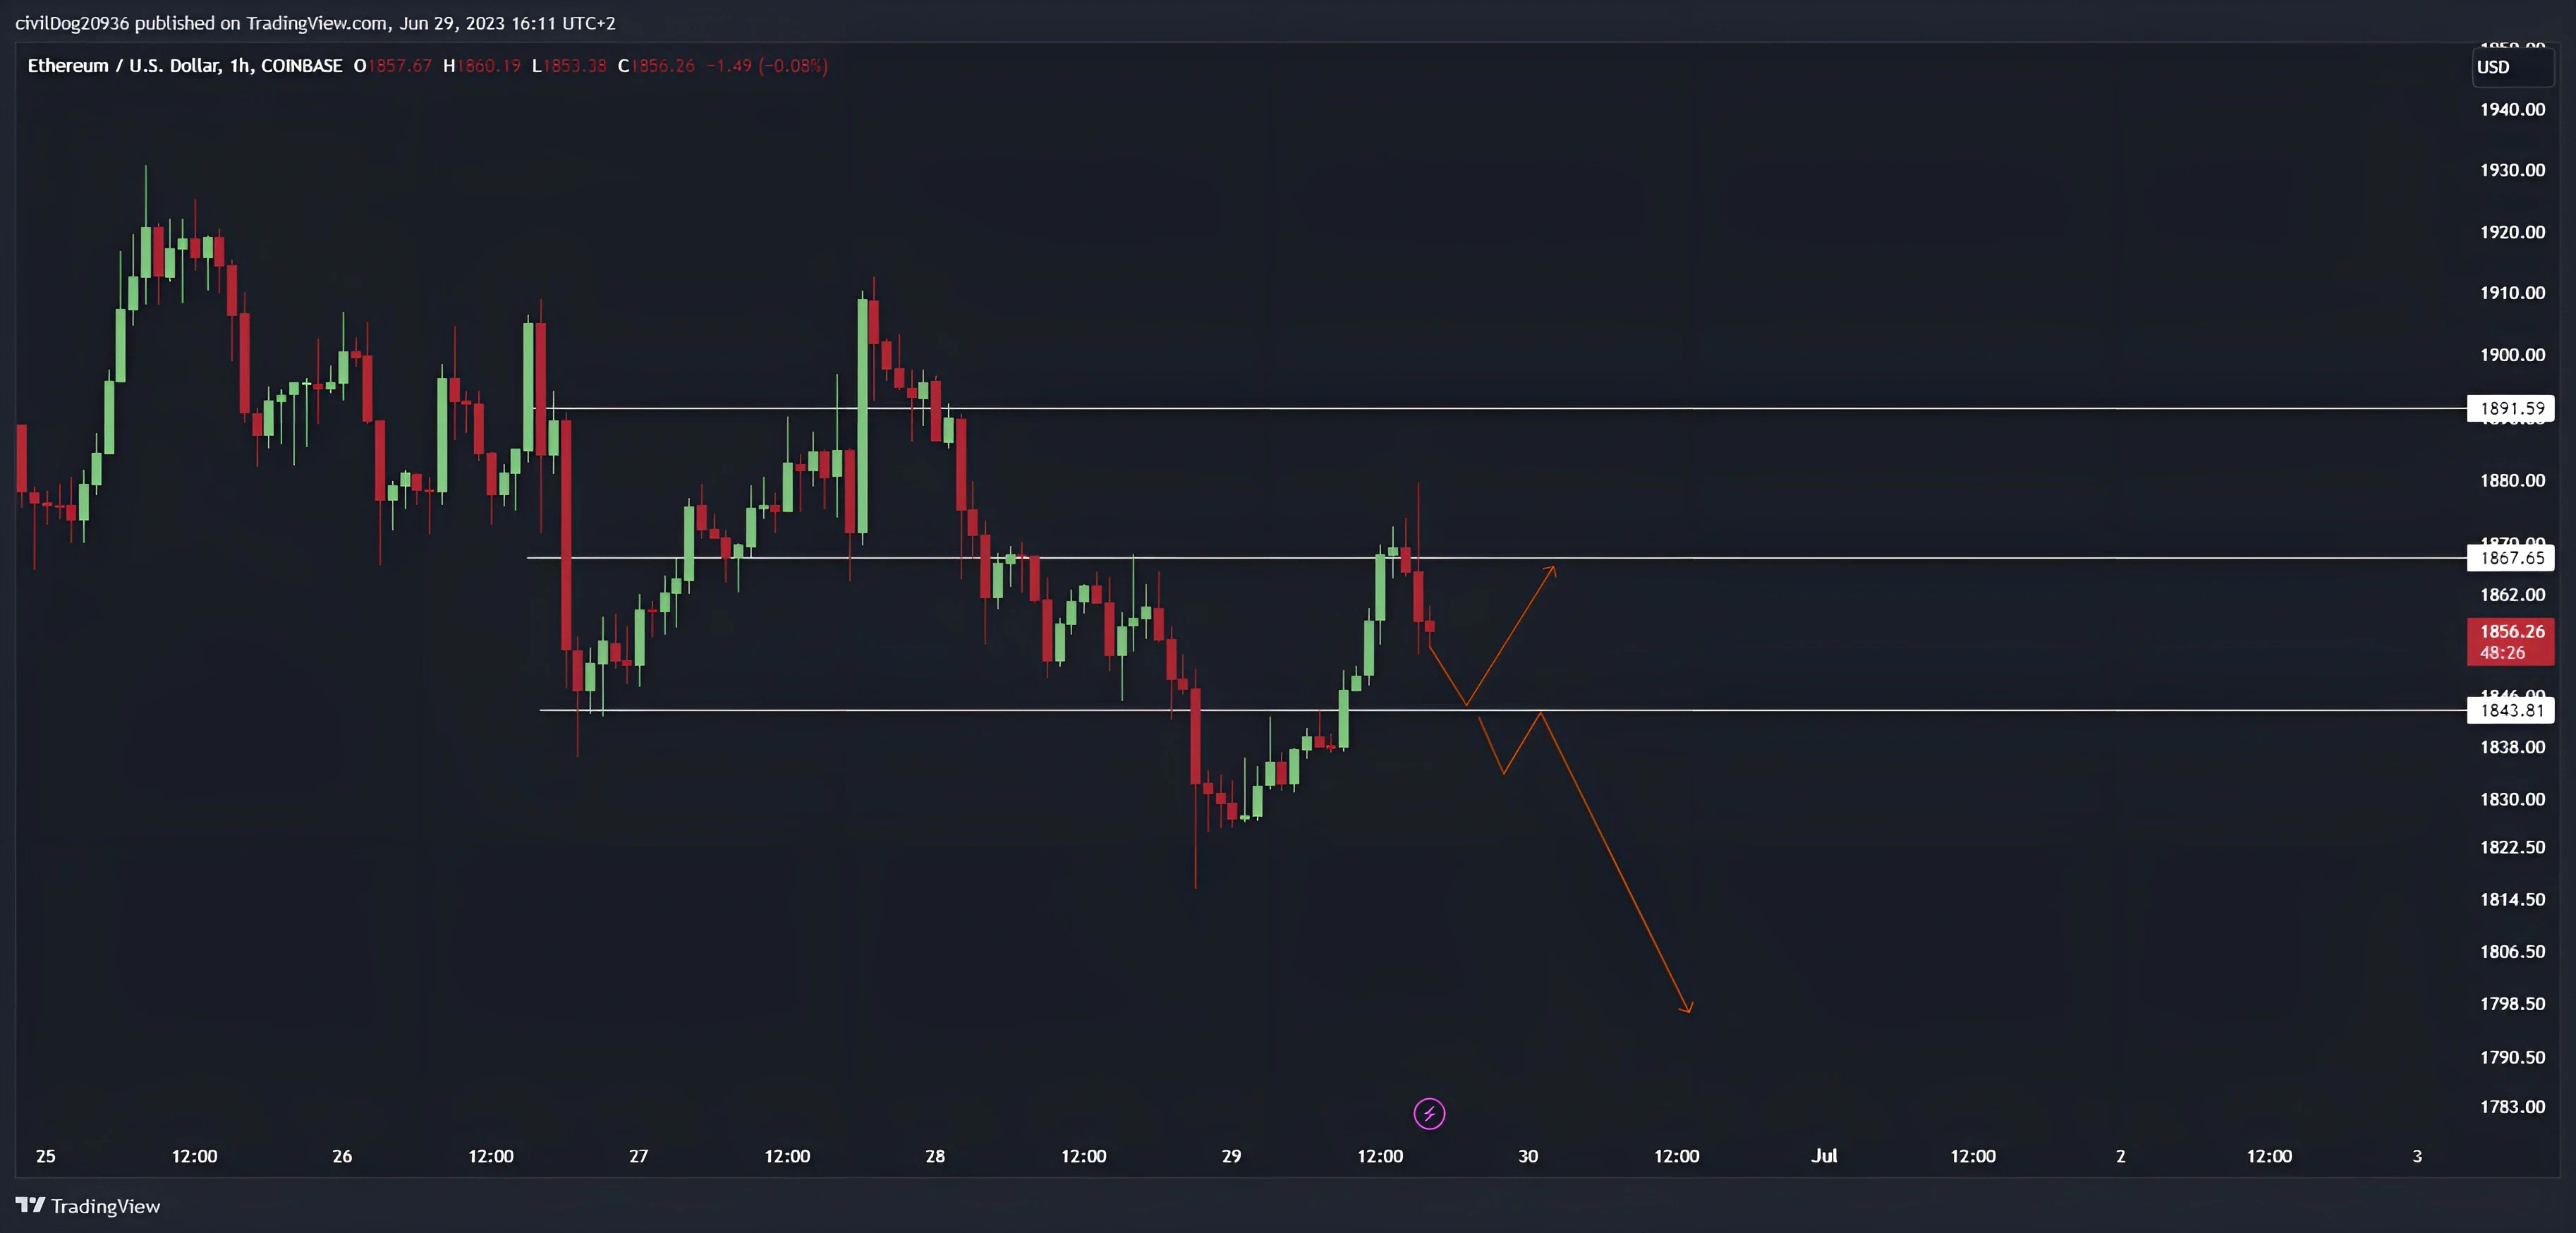
Ethereum | H1
$eth is in midrange, likely to come down to support and then continue further up, if it breaks support and holds below it could likely continue further down.
Prior Analysis Recap
Solana | D1
In line with our prior observation, Solana ($SOL) successfully maintained its support level and witnessed a bullish surge, reaching the resistance zone highlighted on the chart.

Watch List
To effectively monitor the coins discussed in today's analysis, consider creating a watchlist here. This will help you keep track of their price movements and stay informed about potential opportunities. These coins are worth paying attention to, as they exhibit notable market activity and could present promising trading prospects.
Market Wrap-up
In conclusion, the overall trend across various cryptocurrencies remains bullish for the time being, until we see evidence to the contrary. Most of the coins under discussion are navigating within range-bound markets, and their movements are being analyzed on a level-to-level basis. This prevailing state of affairs highlights the importance of ongoing vigilance and thorough analysis in this dynamic crypto landscape.
Disclaimer: Please note that all information, data, and technical analysis provided in this content are for educational and informational purposes only and should not be construed as investment advice, financial advice or trading advice.
This article has been refined and enhanced by ChatGPT.