Coin360 Crypto Technicals: Daily Market Navigator | May 11th 2023
PublishedMay 11 2023
•UpdatedMay 11 2023

Coin360 Crypto Technicals: Daily Market Navigator
Written By Kasper
Welcome to our daily series, where we aim to provide insight and education on the latest price movements of major cryptocurrencies, utilizing our expert technical analysis. In today's edition, we'll be examining Bitcoin, Ethereum, Optimism, Polygon (MATIC), Jasmy, as well as TOTAL1 (total crypto market cap) and TOTAL2 (total crypto market cap excluding BTC) across both higher and lower timeframes. Don't forget to check out our article on trading fundamentals to further enhance your understanding of the market.
Crypto Spotlight
HTF | $BTC, TOTAL1, TOTAL2, $MATIC, $ETH & $OP
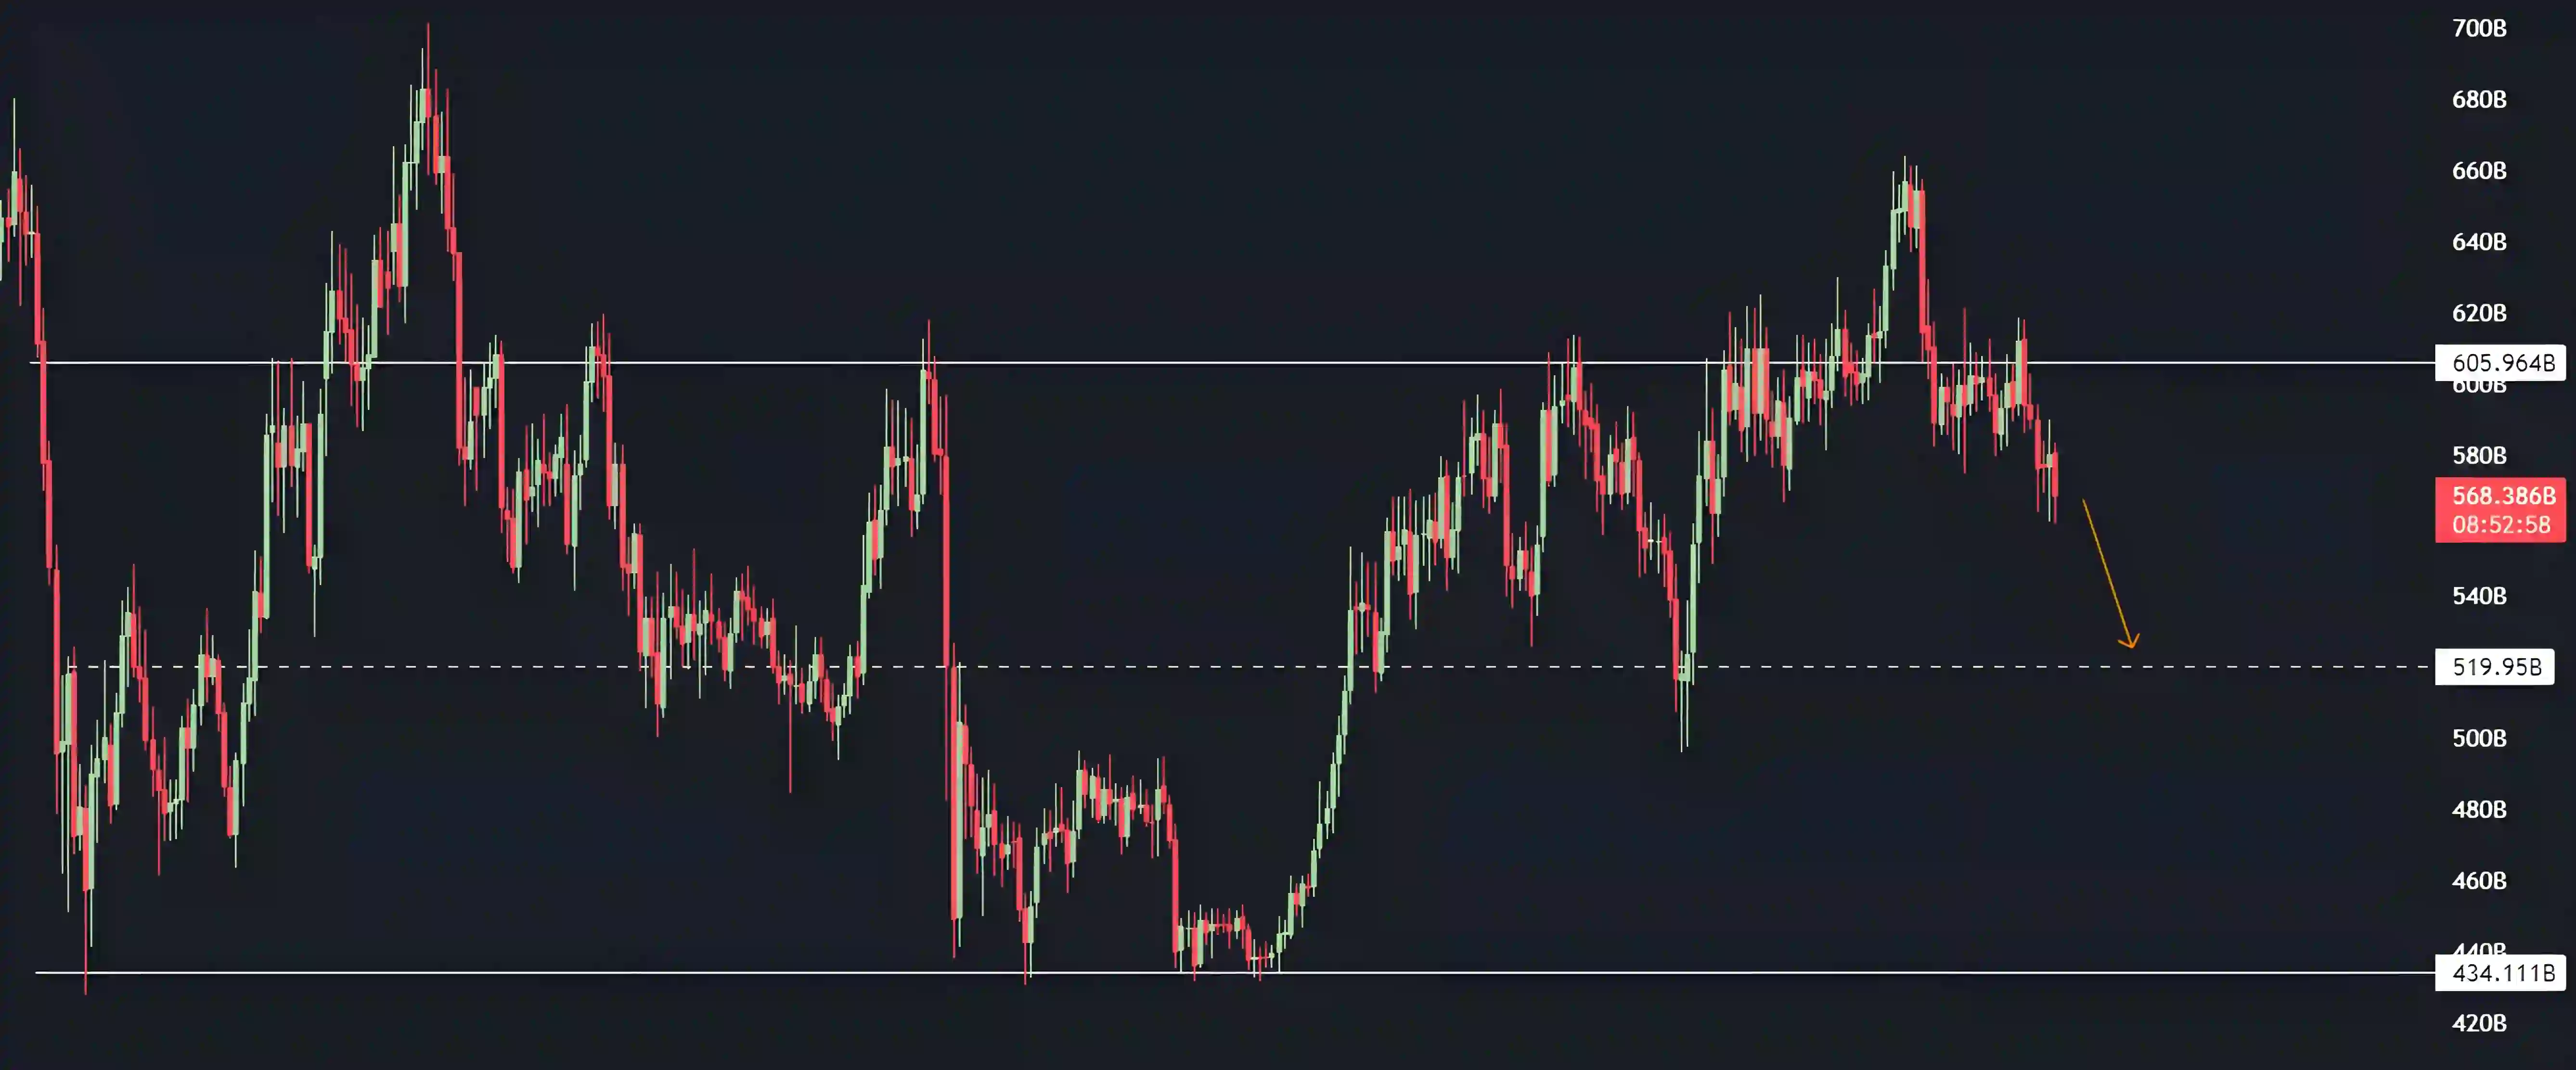
TOTAL1 | D1
$TOTAL1 experienced a deviation from its range highs, encountering a significant resistance zone where the price has had difficulty breaking through and sustaining above. Currently, it appears that the price is moving towards the range mid, as indicated on the chart, in search of further support. To witness additional upside potential, the price would need to maintain its position above the range highs.

TOTAL2 | D1
$TOTAL2 has lingered at its range highs for some time after deviating above, without experiencing a genuine breakout. In alignment with $TOTAL1, it seems that this zone was an area of distribution, and the price is now moving towards the mid-range.
Bitcoin | W1
Bitcoin ($BTC) is encountering resistance on the weekly timeframe at a critical level, which once acted as support prior to a notable sell-off, as depicted on the chart. A robust bullish scenario may unfold if the price can establish itself above this resistance point. Yet, at the moment, a retracement towards the $25k support level appears likely, given its significance as a major support zone. Moreover, the Stochastic RSI has started to roll over in the upper range, indicating that, in conjunction with the chart, Bitcoin might be entering a bearish phase.

Bitcoin | D1
Examining Bitcoin on the daily timeframe as a range, $BTC currently sits at the range quarters. If the price can maintain this level, we could anticipate a bounce to liquidate some late short sellers. However, if BTC fails to hold this position, it would align with the bearish outlook on higher time frames, possibly heading towards the range lows. It's also worth noting that we may see the price oscillate between the range mid and range quarter for an extended period, as has occurred in the past.

Ethereum | D1
On the daily timeframe for Ethereum ($ETH), we observe that it's trading inside a range, as illustrated on the chart. The price clearly deviated from the range highs before undergoing a retest. As the price couldn't sustain the highs, it's likely to move towards the range midpoints. If the price shows strength above the range highs, we may see increased upside potential.

Optimism | D1
On the daily timeframe, Optimism ($OP) is persistently trending downwards, as mentioned in yesterday's article. The mid-range is the most likely area where the price could find support, provided it holds this level. Keep an eye on the mid-range for potential signs of price stabilization or reversal.

Optimism / Bitcoin | D1
$OP/BTC is currently trading in a relatively undefined area. Unless it can regain strength against BTC by holding its position or moving towards the range highs, the next significant area of support is likely to be around the range mid, provided it holds. If this level fails to provide support, $OP could potentially revisit its range lows. Keep an eye on these crucial levels for indications of the price direction.

Polygon | D1
On the daily timeframe, Polygon ($MATIC) has lost its mid-range, and in line with its Bitcoin pair, it appears that MATIC is heading towards the range lows, as illustrated on the chart. Keep a close watch on these levels to identify potential support zones or further downward movements.

Polygon / Bitcoin | W1
$MATIC/BTC is trading between the range quarter and the range mid at the moment. The price is more likely to approach the range quarter for a potential bounce, provided that the level holds. Monitor this area closely for signs of support or a possible reversal in the price direction.

LTF | $BTC & $ETH
Bitcoin | H4
On the 4-hour timeframe, Bitcoin ($BTC) is facing rejection at the mid-range and currently trades in an ambiguous area between the range lows and range mid. If the price approaches the range lows and manages to hold, Bitcoin could experience some upside. However, if it breaks this level, it's likely that BTC will continue to decline. Keep an eye on these key levels for indications of price movement.

Ethereum | H4
On the 4-hour timeframe, Ethereum ($ETH) is entering a new range, as shown on the chart. As discussed yesterday, losing that level would likely result in lower prices for ETH. If the price continues to hold below $1827, ETH might face further downward pressure. However, if the price deviates and begins trading above $1827, we could anticipate increased upside potential. Keep an eye on these crucial price levels for possible trend shifts.

Key News
Upcoming news that may influence volatility and price action includes today's PPI release, which introduced some market fluctuations, albeit not significantly. There are no major short term macroeconomic events on the horizon, so the market's primary focus will likely be on technical and fundamental factors driving individual cryptocurrencies.
Notable Market Movers
Jasmy | D1
$JASMY faced rejection at its range highs and has since experienced a steep decline, resembling a waterfall, as depicted on the chart. If the range lows manage to hold, a potential long position could be considered. However, given the aggressive nature of the price drop, it's uncertain whether the range lows will hold or not. Keep a close watch on these key levels for possible support or further downward movement.

Watch List
To effectively monitor the coins discussed in today's analysis, consider creating a watchlist here. This will help you keep track of their price movements and stay informed about potential opportunities. These coins are worth paying attention to, as they exhibit notable market activity and could present promising trading prospects.
Market Wrap-up
In summary, major cryptocurrencies like Bitcoin and Ethereum are experiencing resistance and trading within ranges, while altcoins such as Optimism and Polygon face downward pressure. Jasmy has seen a steep decline after rejecting its range highs. Market volatility was slightly impacted by today's PPI release, but no significant macroeconomic events are expected soon. Keep an eye on key support and resistance levels for potential trend shifts and trading opportunities.
Disclaimer: Please note that all information, data, and technical analysis provided in this content are for educational and informational purposes only and should not be construed as investment advice, financial advice or trading advice.
This article has been refined and enhanced by ChatGPT.